Market Intelligence Pricing
Strategic Market Intelligence
Turn market complexity into clarity. These services help you size opportunities, track trends, and make smarter growth decisions with data-driven insights tailored to your business.

Market Sizing Model
Custom TAM/SAM/DTAM model tailored to your business.

Market Tracking Report
Quarterly TAM trend updates with commentary and charts.

Custom Market Report
In-depth analysis by end market, supplier, or competitor.
Visualization & Reporting Solutions
Make your data impossible to ignore. From dashboards to executive presentations, we transform raw numbers into visuals that inform, persuade, and drive action.
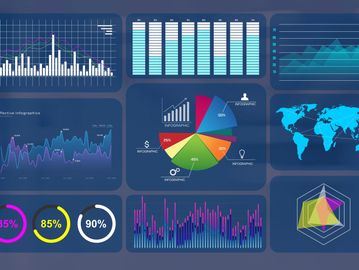
Dashboard Design
Interactive Power BI dashboards with KPI tracking and visuals.

Data Visualization Package
Up to 10 professional-quality charts or visuals.

Executive Presentation
Polished PowerPoint decks with structured storytelling.
Pricing may vary depending on project scope. Custom packages available upon request.